
 Back
Back
Fleet Total
Number of aircraft OOS:


Saved +


Digitizing
Inspections

Revolutionary
Reporting

Financial
Benefits
Data
Collection
Data is collected either manually or automatically
through the
use of a drone.


Digital
Inspection
Automated
Inspection
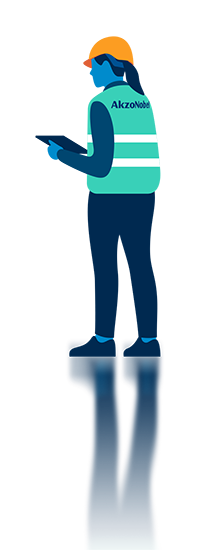
Manual inspections
using a
digital App
Experts from AkzoNobel use the digital App to store the information collected, such as dry film thickness, color variation, gloss and general appearance, as an Audit Report on an iPad or tablet. The data is then fed back to a database which tracks the fleet's performance over time.
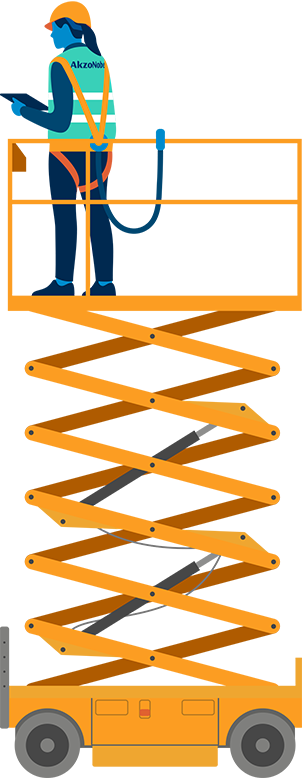
As part of our digital inspection package, you'll also receive:
- Condor full body harness
- BYK Spectro2Guide
- iPad Pro w/ Falcon Heavy Duty Case
- PosiTector 6000 Pro FN3


Inspection Services?

Automated inspections
using drone
technology
Automated inspections are conducted by drones which fly in a set grid over the plane's surface, taking up to 1,000 HD photos.
This standardizes the inspection and is more objective. The drones’ machine learning algorithm analyzes the photos and identifies issues on the paint surface in exactly the same way, every time.
It is also faster and more in-depth than a manual inspection; an automated drone can scan an entire narrowbody aircraft in less than an hour.
Inspection Services?


Real-time Reporting
& Predictive Maintenance
Detailed reports for the here and now and future maintenance scheduling.

Reporting
Data
Predictive Maintenance
Real-time Dashboard
& Data-Driven
Reporting
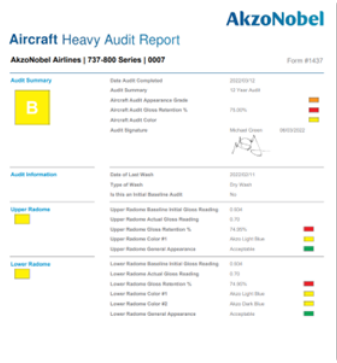
Detailed audit reports
A detailed audit report provides the baseline against which a future paint schedule can be defined. It includes dry film thickness measurements, gloss readings, color and a general appearance rating on all parts of the airplane, from the radome, captain and forward entry through to the fuselage, wings and engines.
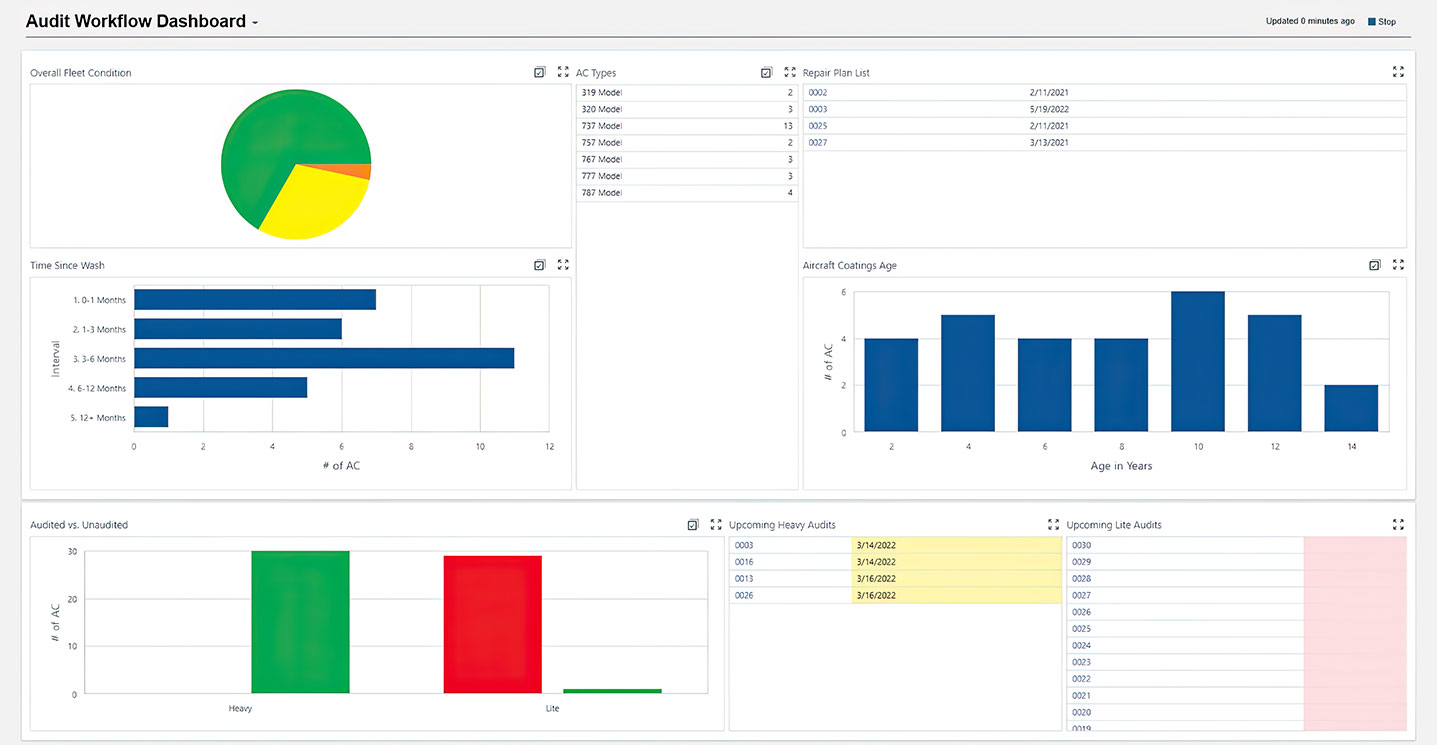
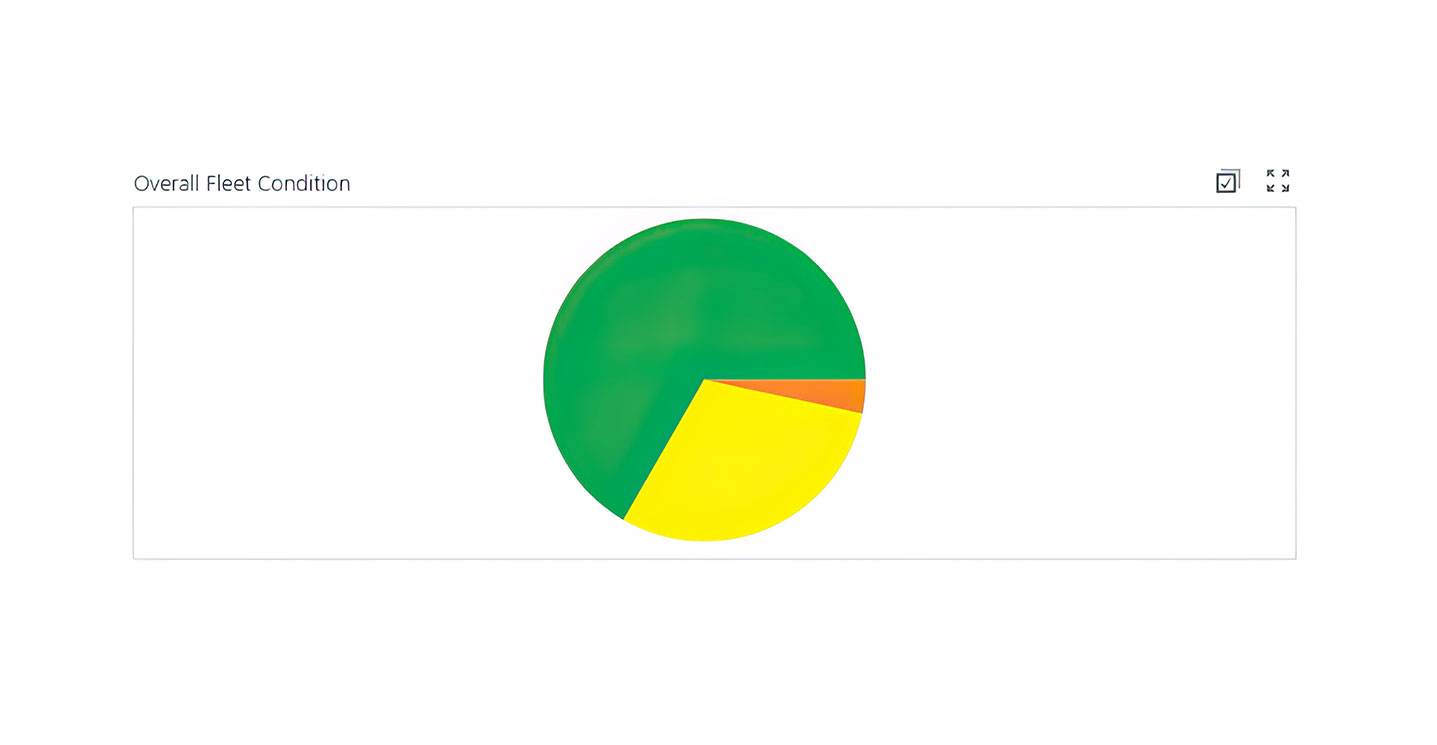
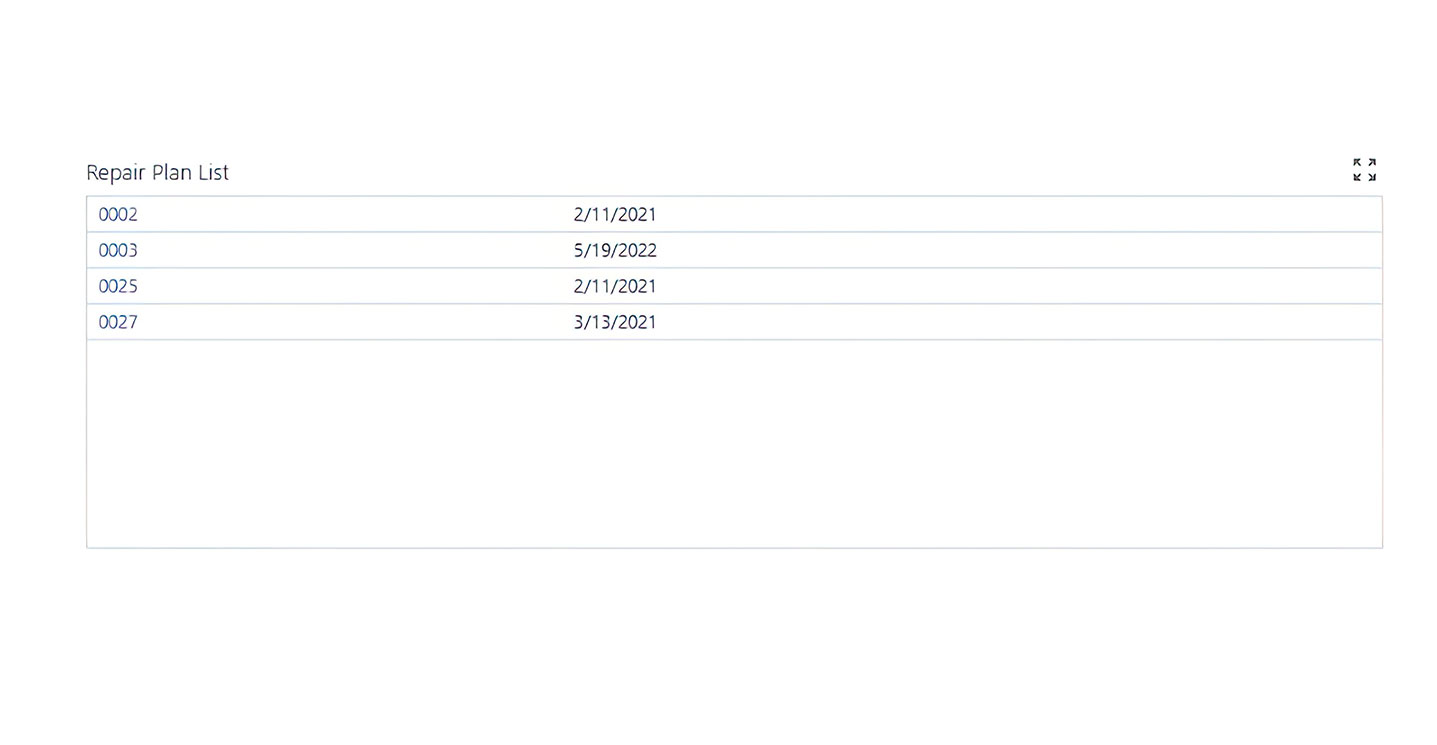
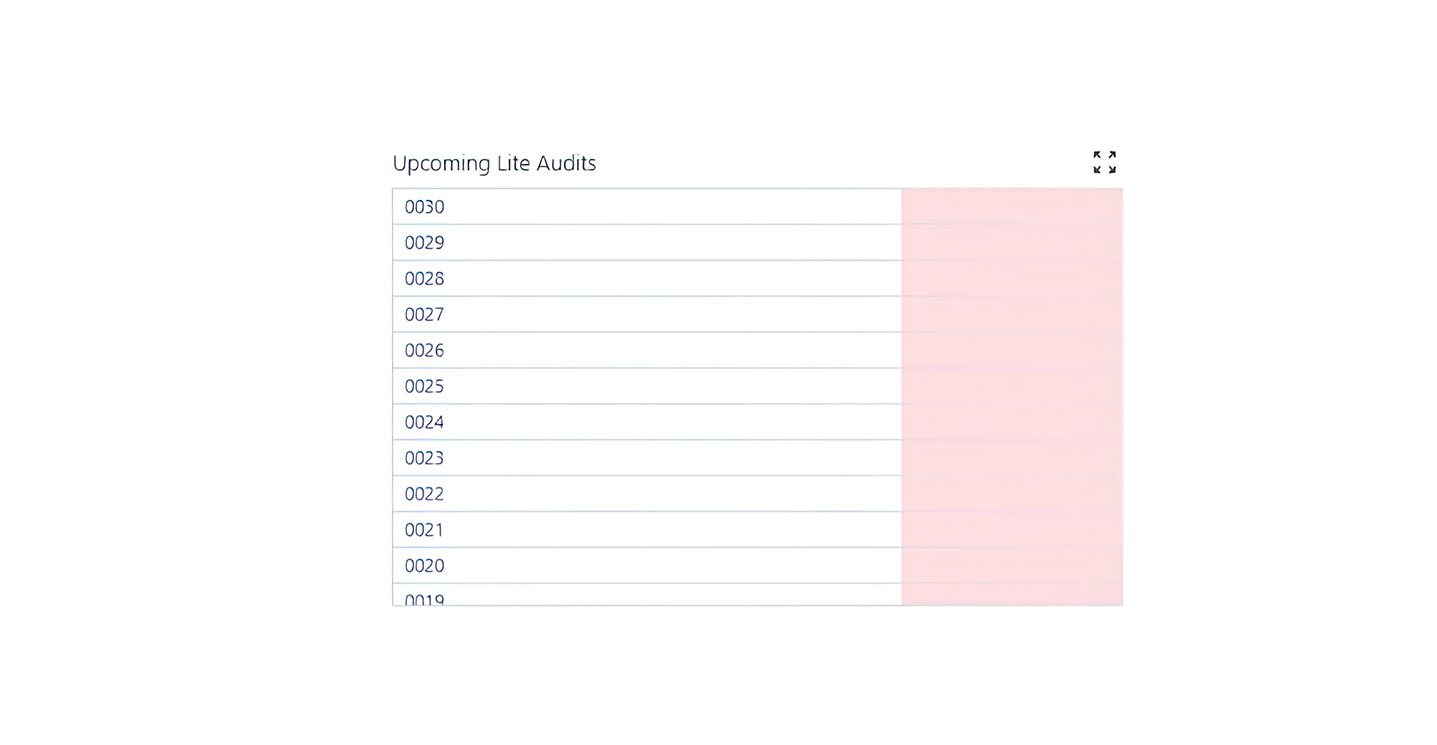
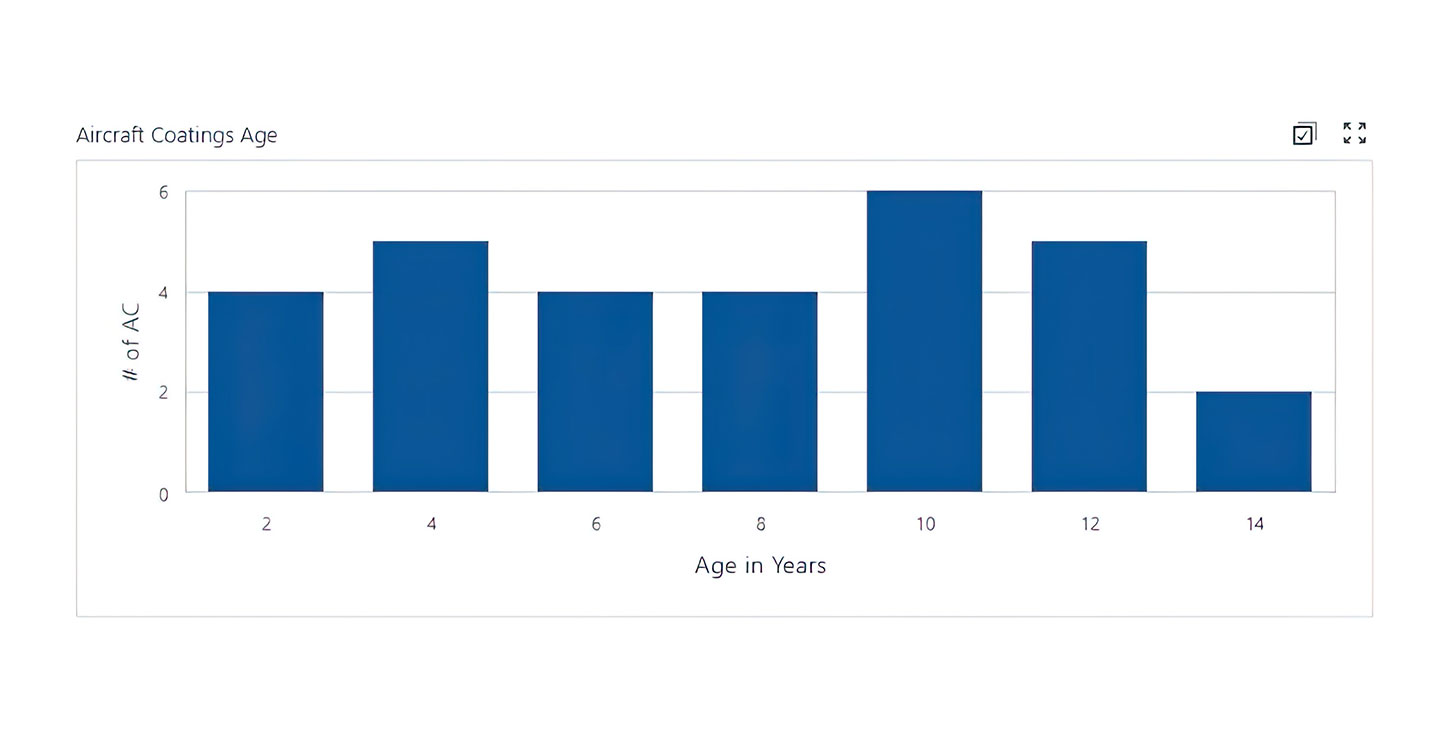
Fleet dashboard
An audit flow dashboard provides an at-a-glance view of the overall fleet condition with specific detail on a coating’s age, upcoming audits and a repair list plan.
Repair reports
A repair report highlights areas of concern where a touch-up or more extensive repair may be required prior to an airplane requiring a full repaint.
Real-time Dashboard
& Data-Driven
Reporting
Fleet data over time
By analyzing this information, and mapping it over time, a more accurate maintenance and repaint schedule can be calculated using quantitative data. It becomes easier and more accurate to determine when an aircraft needs to be repainted, rather than simply using time or flight hours.
Flight data
Schedules can be created that balance the practical performance of a coating and where the aircraft in a fleet are being operated (i.e. the different flight paths, distances, heights, etc.) against the aesthetic/marketing (i.e. branding) and business needs of the airline.
Weather data
Schedules also take into account the environment in which the individual aircraft have been flying, and the potential impact of different climactic conditions on the aircraft coating.

Proactively Manage
Your Repaint Cycle
Multiple Data Sources
Multiple data sources enable you not only to determine when an aircraft needs to be repainted now, but also predict when it will need repainting in the future. By analyzing data across the entire fleet, it can also predict when similar aircraft, with similar coatings and flying similar routes will also need to be repainted.
Model the optimal maintenance cycle
Predictive maintenance allows for aircraft to be on the ground in a more operationally efficient and cost-effective way.
Value Calculator
The proof is in the numbers
Calculate how much you could save based on the size and status of your existing fleet.
Size of fleet
Average Repaint Cost/AC
Average OOS Revenue Loss/AC
Annual Aircraft Repainted
8
Repaint Cost Annually
Out of Service (OOS)
Revenue Loss Annually
Total Cost Annually
Annual Aircraft Repainted
8
Fewer Aircraft Repainted Annually*
Annual Repaint Cost Savings*
Annual OOS Revenue Retention*
Out of Service (OOS) Revenue Loss Annually
OOS Revenue
Loss Annually
Repaint Cost
Annually
* vs. 8 year cycle

Average age of repaint